


#forecast 042 : Dips
Dear subscribers,
Welcome to The Bitcoin Forecast #42.
Top level summary for 12th Dec 2021 (current price $50.5k):
Macro structure: HODLer buying has soften recently with this month’s price pull back, however long term holders remain in a region of peak accumulation. Structurally we are still in a bullish macro region. Despite bearish price action the underlying structure has no signs of a bear market.
Short term: HODLers have been buying the dip. Coins are moving off the exchanges. Coins held by HODLers have been rising, recovering from recent weakness. Our on-chain Supply Shock valuation model implies BTC is presently trading at a $6k+ discount.
Data from derivative exchanges is showing an uptick in demand, a bullish divergence has formed suggesting the bottom may be in.
BTC price action expectation: Price recovery from lows with further consolidation over the weeks of December.
Price action conviction: Medium.
All the best until the next letter.
-W
LIVE EVENTS
We will continue our live event experiment. There will be two interactive Zoom calls every week (one for each major timezone region). I’ll issue an email alert to paid subscribers before the calls.
DON’T GET REKT!
Please do not trade on this forecast assuming perfect accuracy. All forecasts are probabilistic with roughly 80% historical reliability for short time frame forecasts. Short time frames are subject to unpredictable events and the randomness of markets, please use appropriate risk management. Longer range forecasts are more reliable as it takes time for fundamentals to play out.
Analysis Breakdown
Macro: No evidence of a bear market
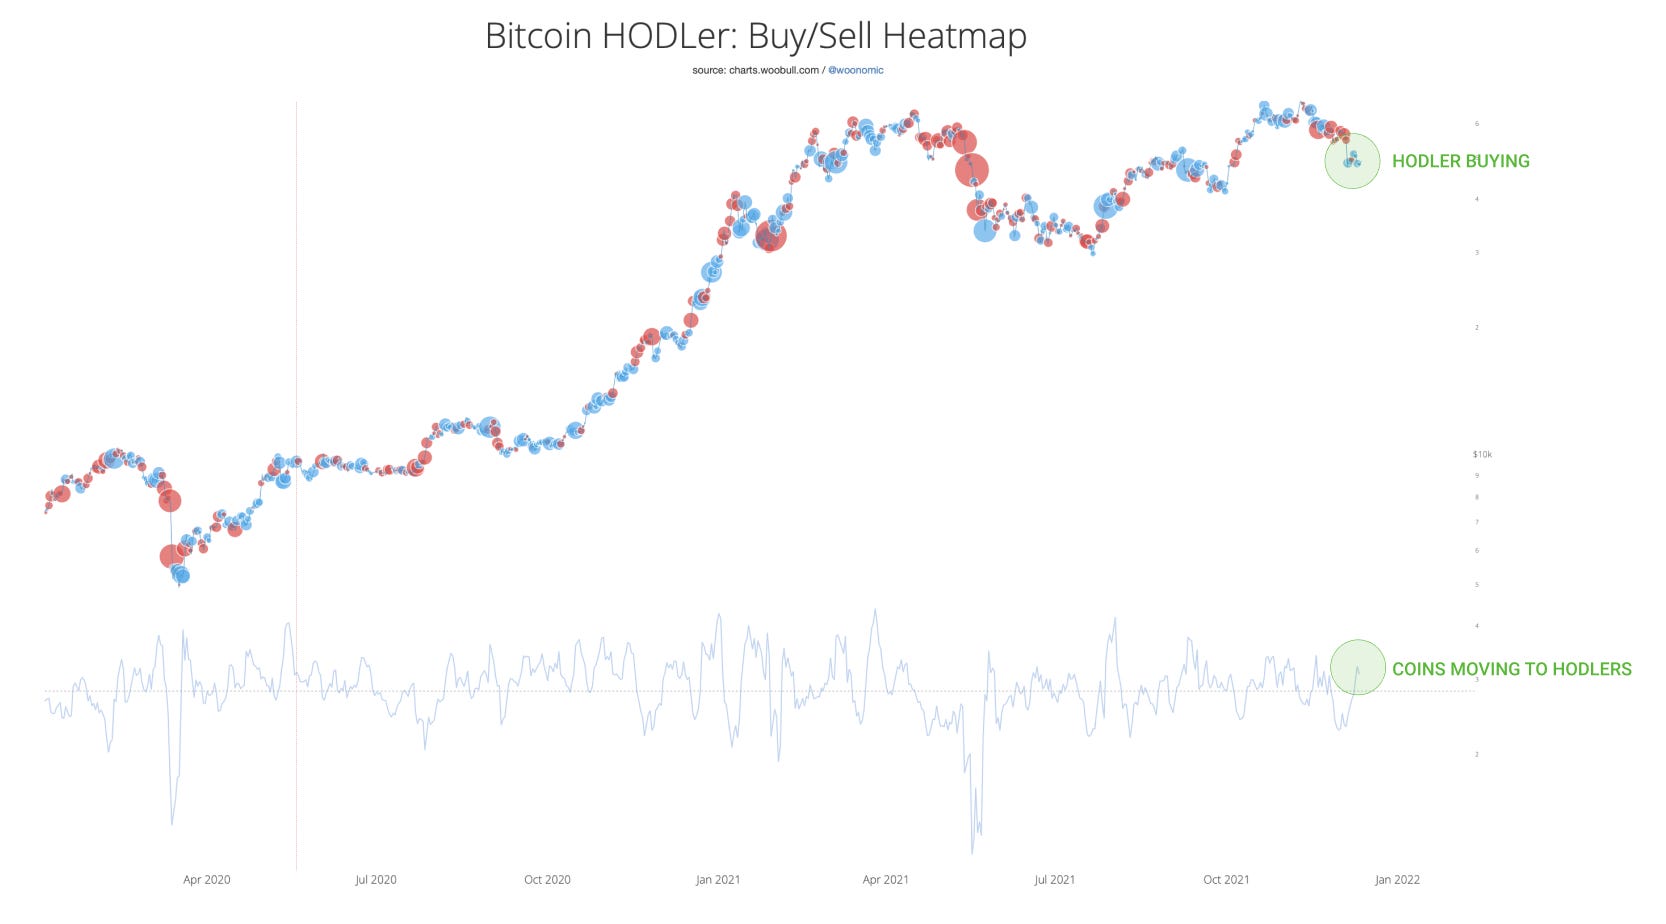
While price has pulled back from highs a month ago, the net flow of coins moving towards HODLers remains in the bullish region. The heatmap below show that it has softened since a month ago, but there has not yet been sufficient sell-off to warrant a deeper bearish phase. We watch this space closely.

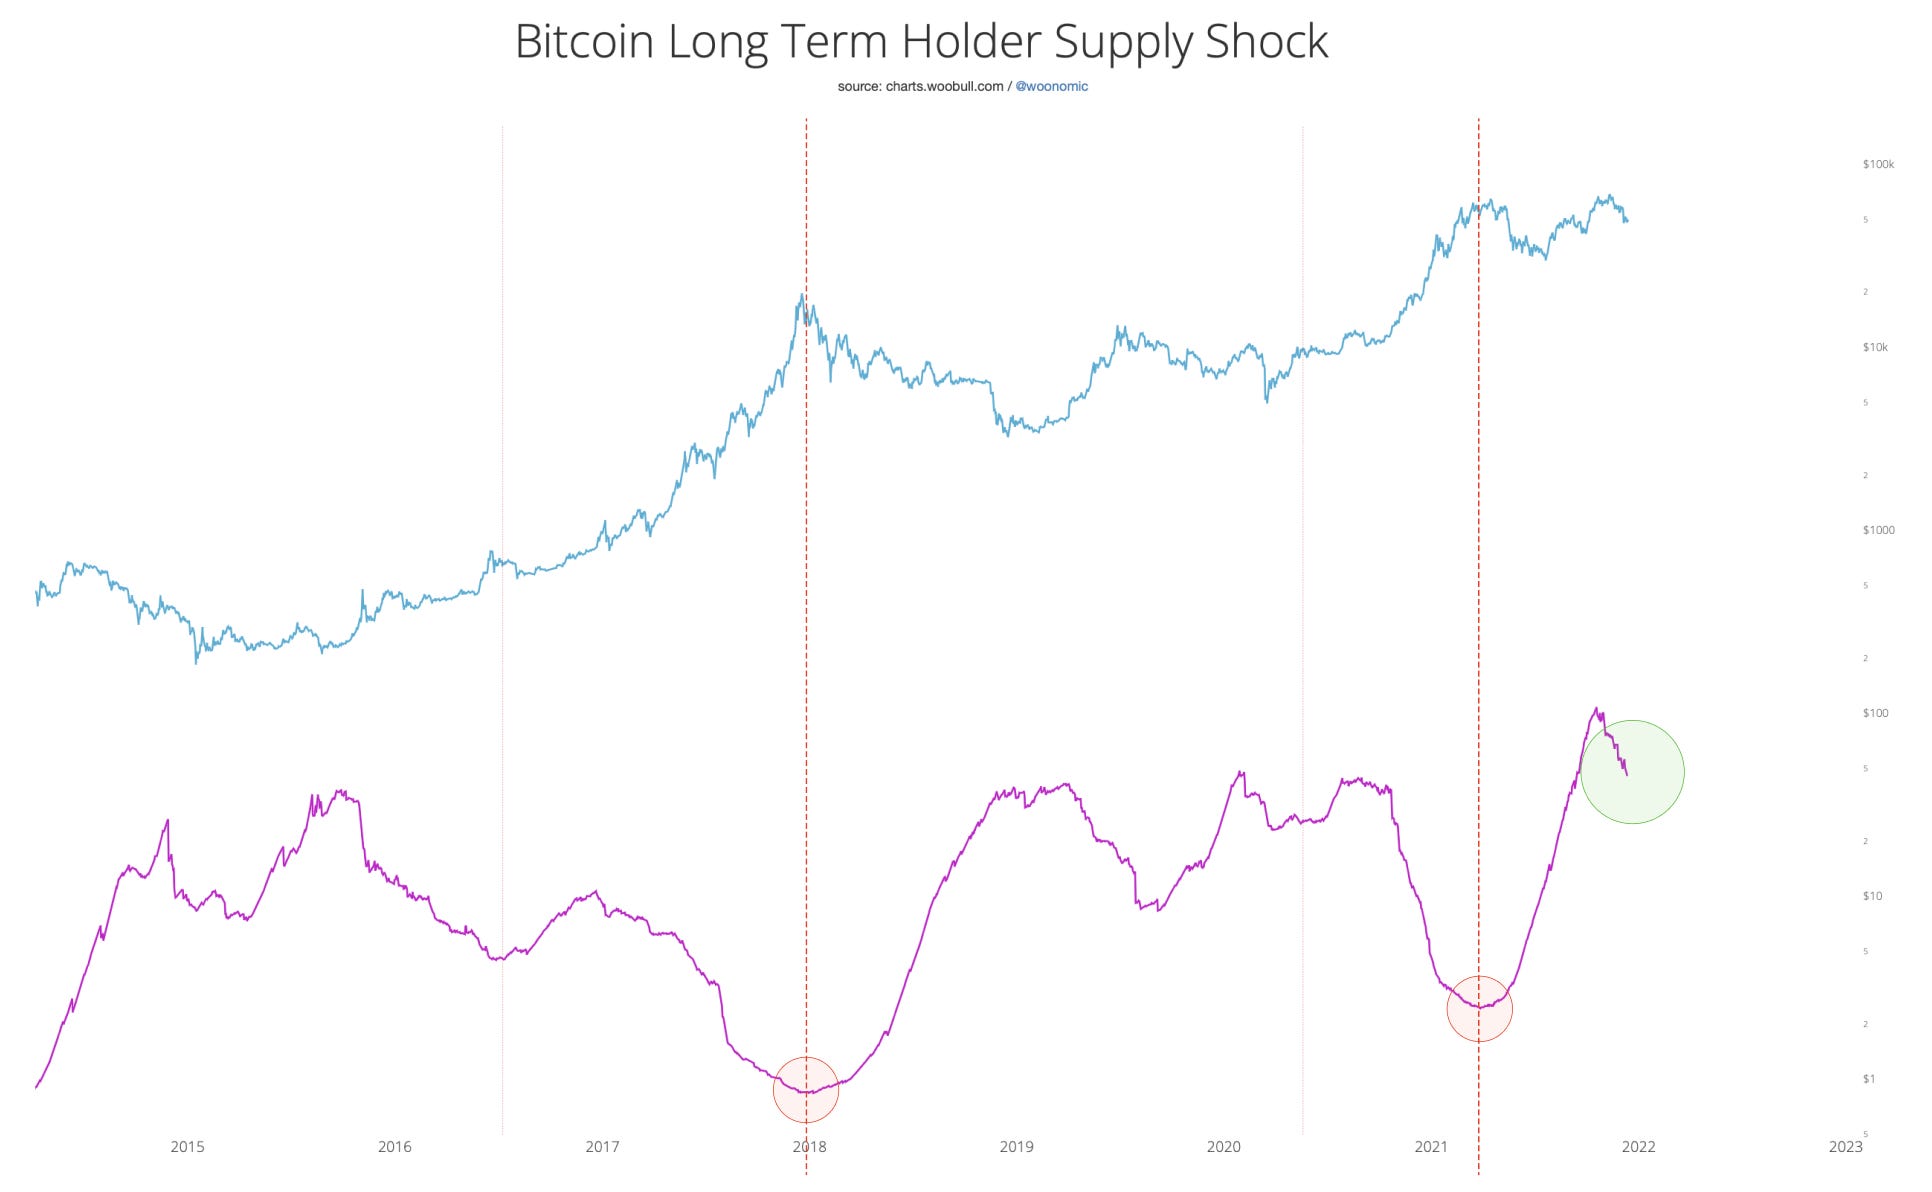
Meanwhile we can see in the chart below, long term holders have been selling down and taking profits, but as a cohort they continue to be in a region of peak accumulation. Bear markets coincide when these holders have divested of their coins, despite the fear in the market, structurally we are not setup for a bear market.
Short term: Investors spotted buying the dip
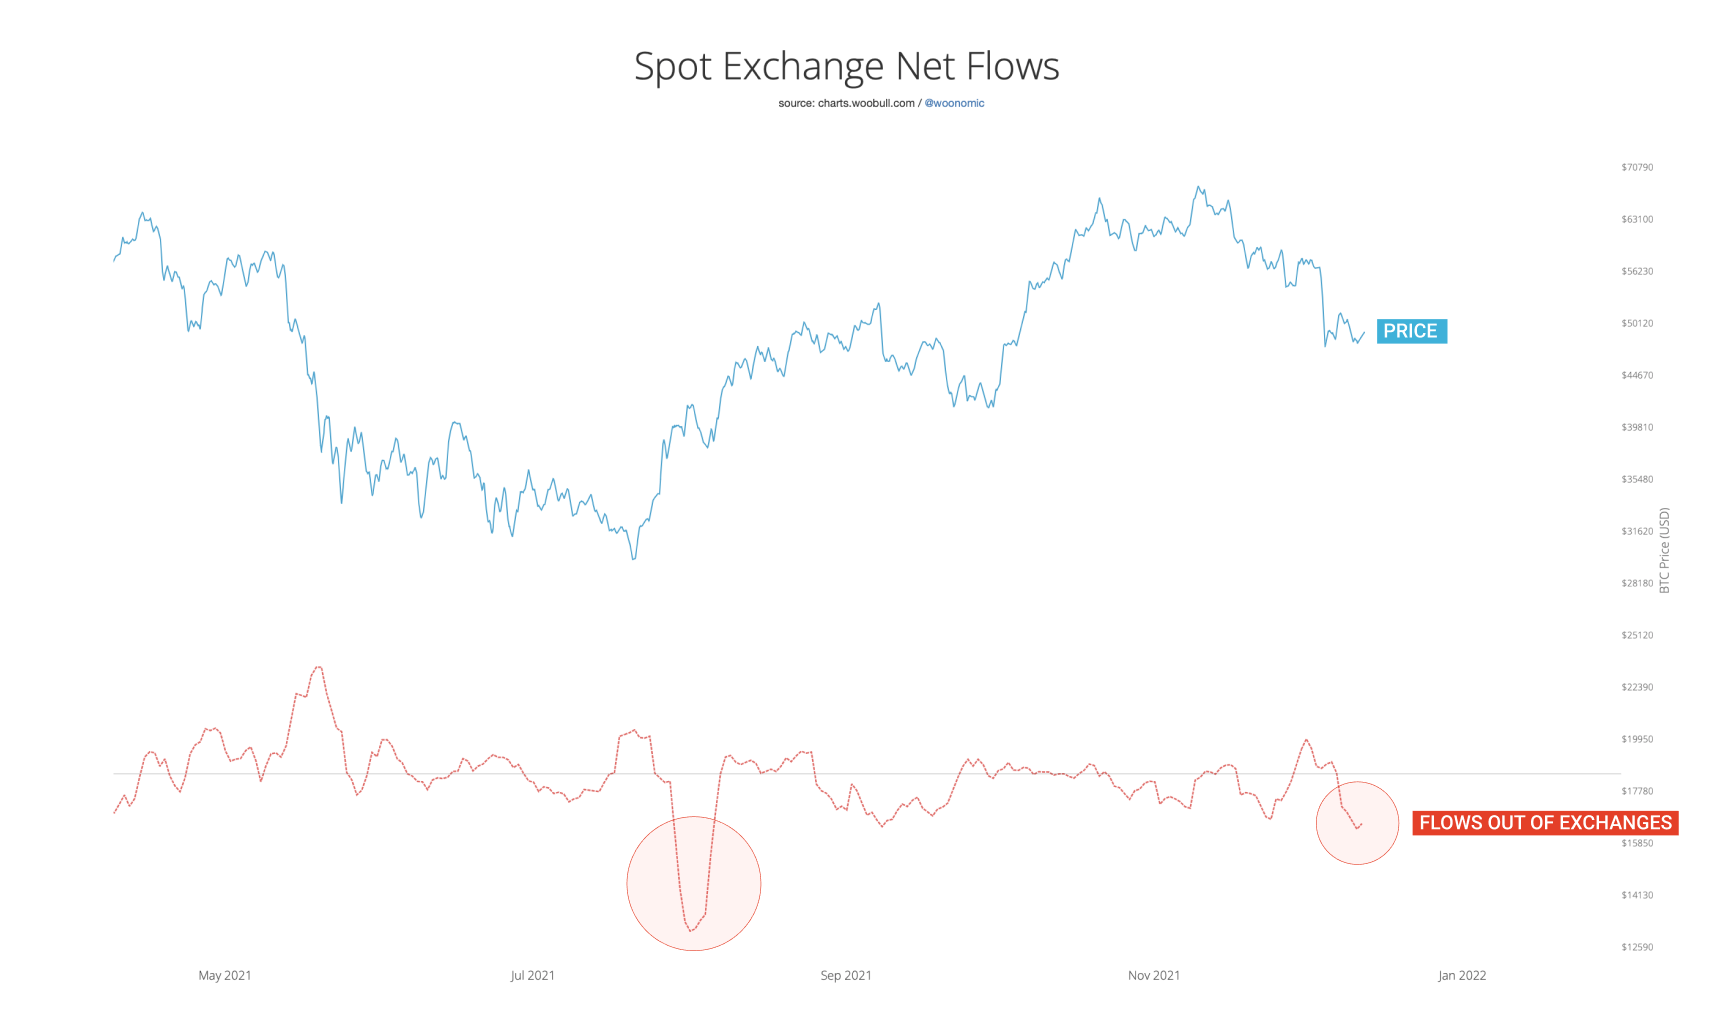
We are now in a region of coins moving off exchanges, signifying significant spot demand.
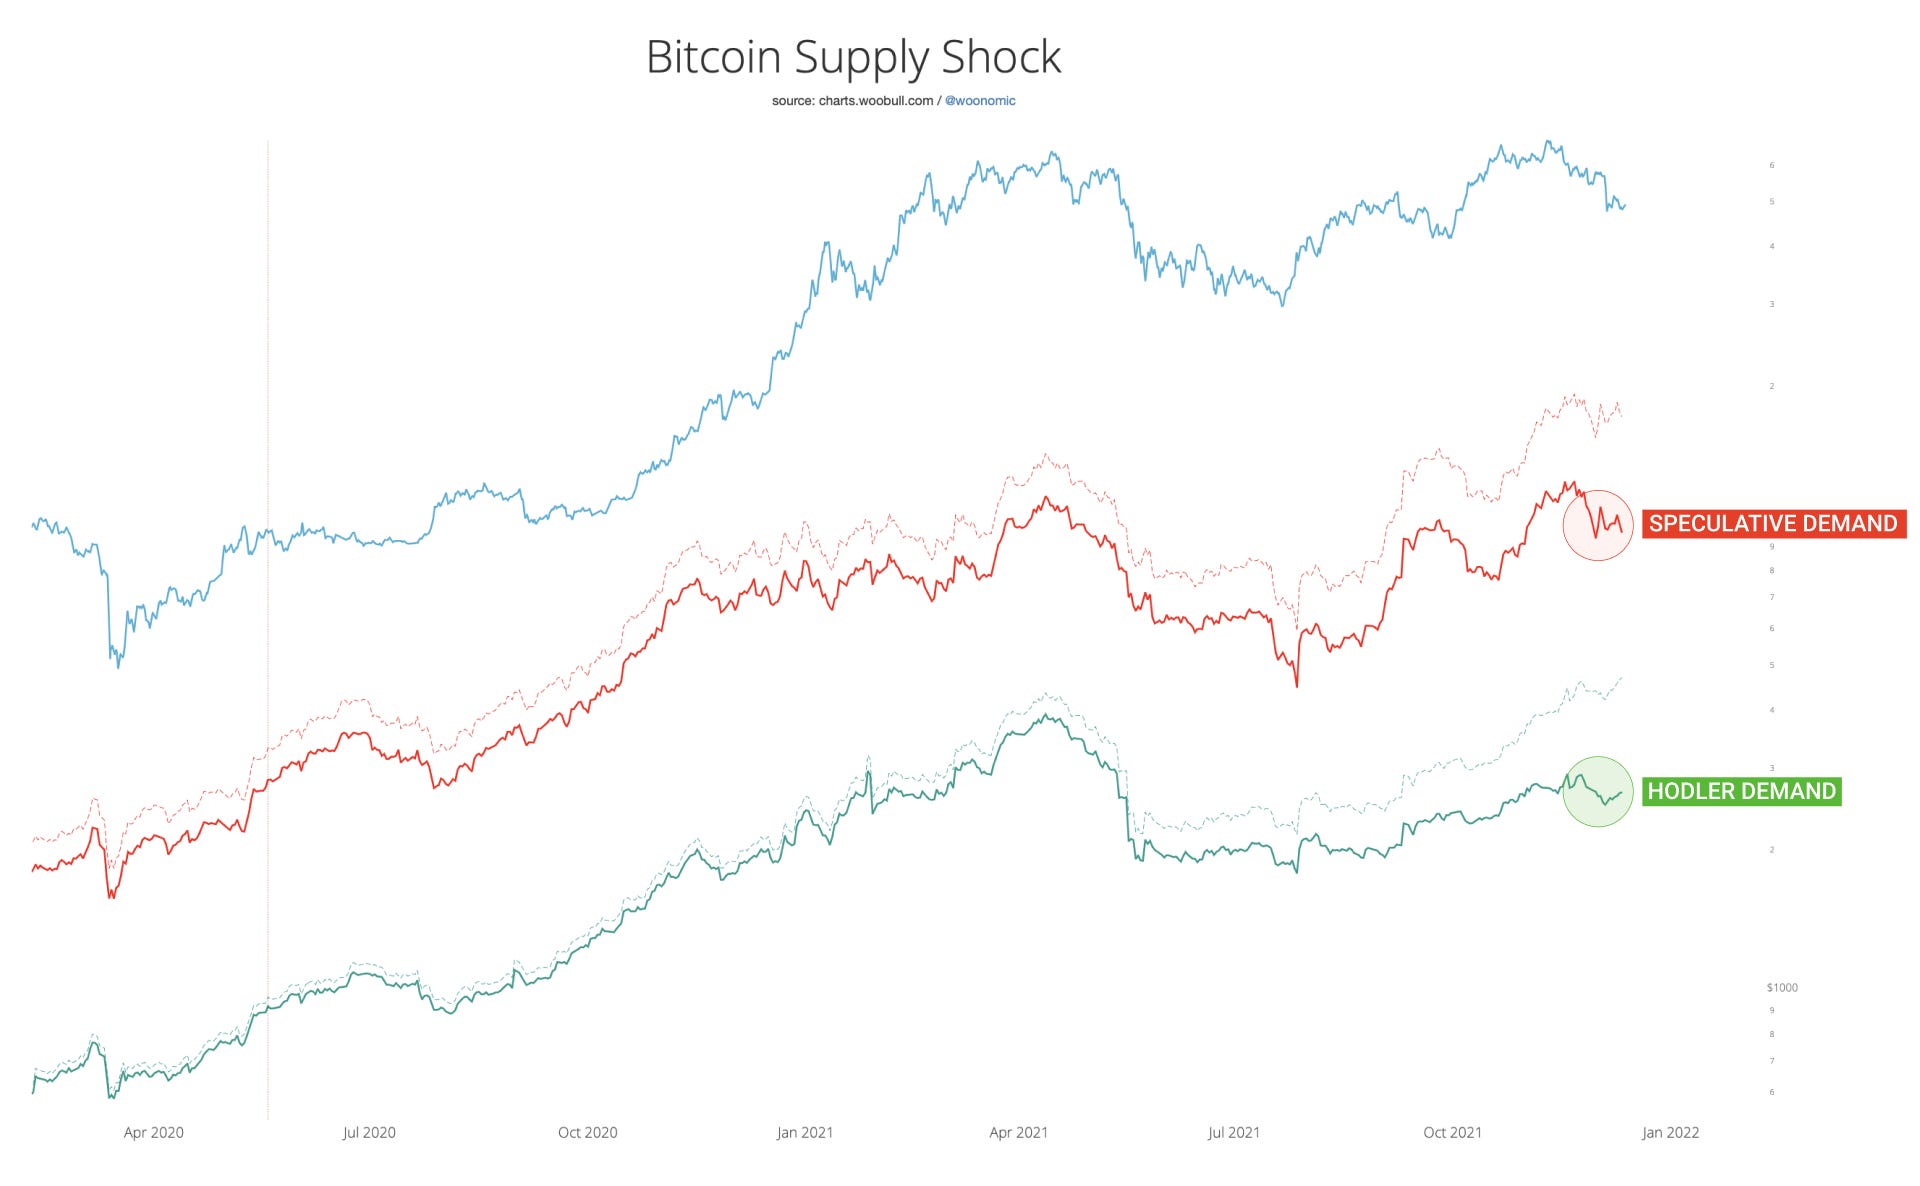
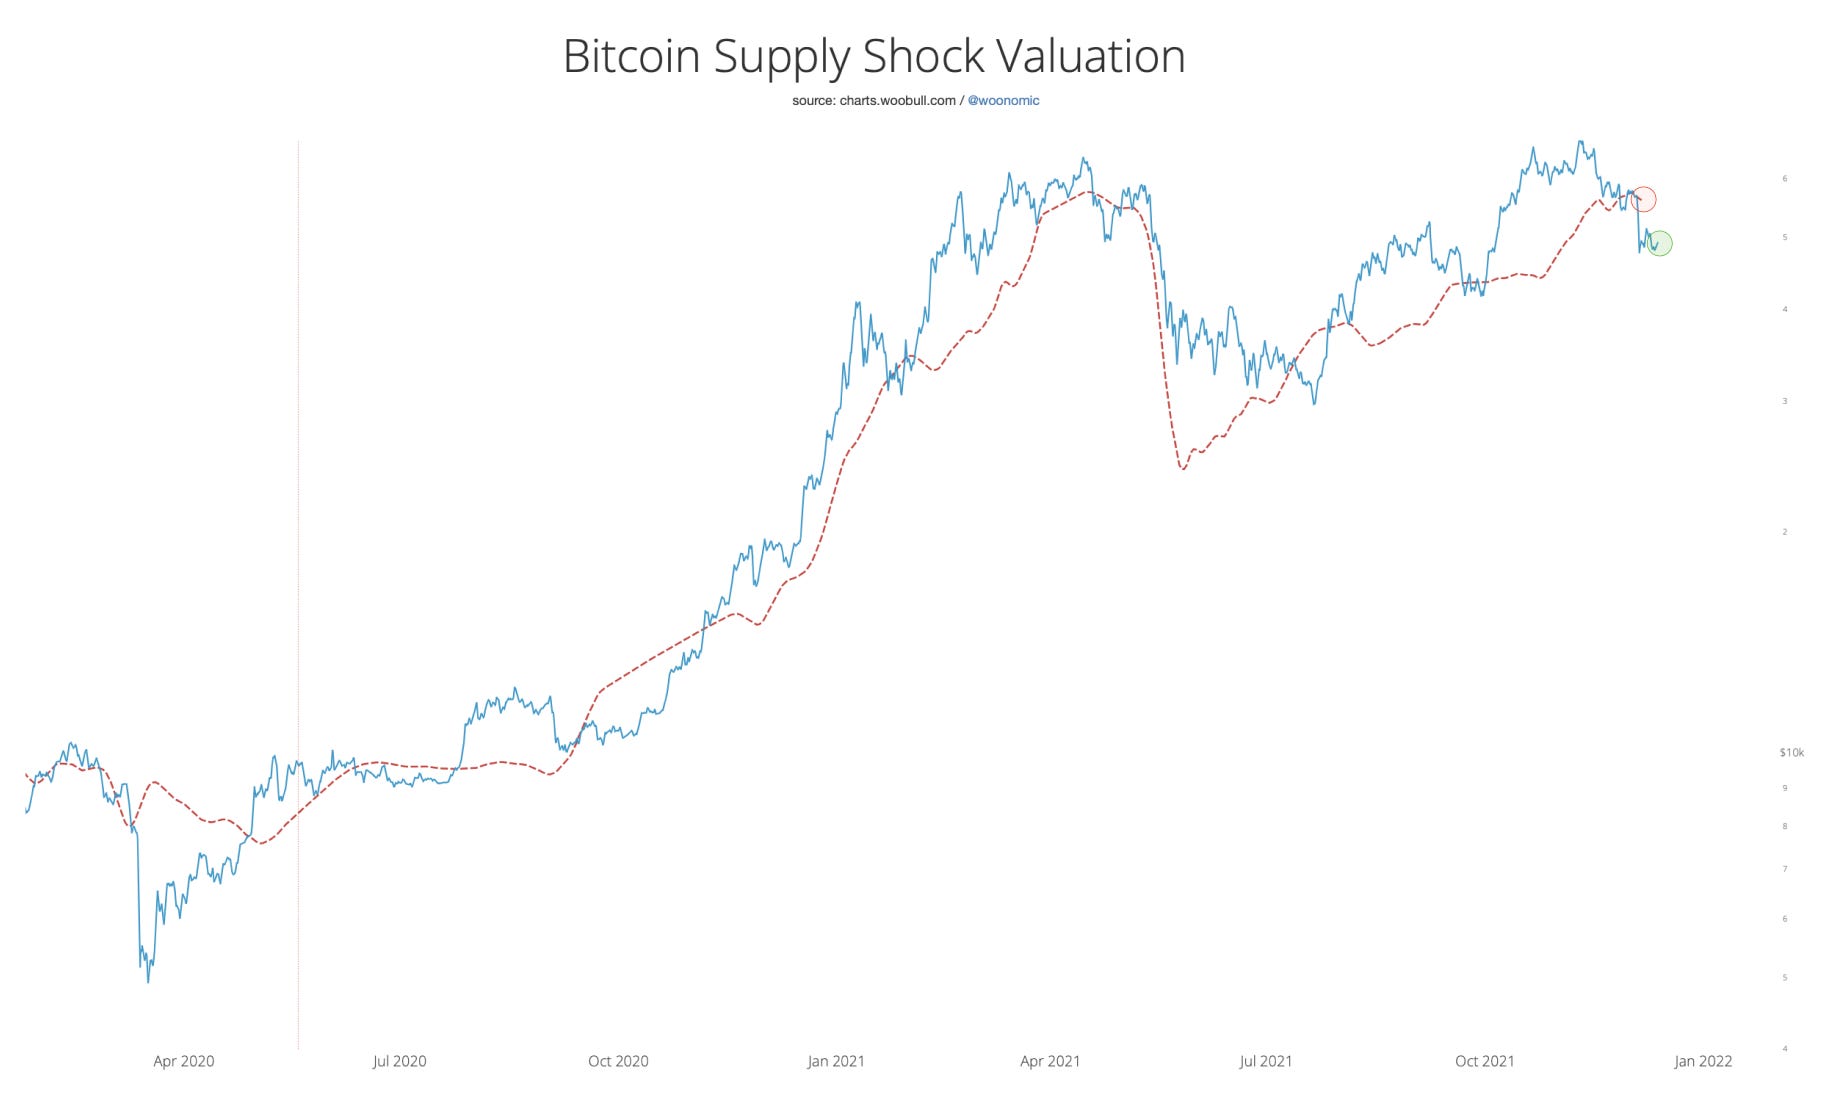
Looking at the on-chain “Supply Shock” demand, the structure has been recovering from recent weakness.
Below is our heatmap visualisation of the same data. We are seeing HODLers buying the dip. It’s a moderate level of buying, while not necessarily short term bullish, it does provide strength to the market to stave off bearishness.
Using our Supply Shock valuation model which finds how the market priced BTC at prior times where on-chain demand was at similar levels we can see a valuation slightly below $60k. Bitcoin presently is trading at a discount to this valuation.
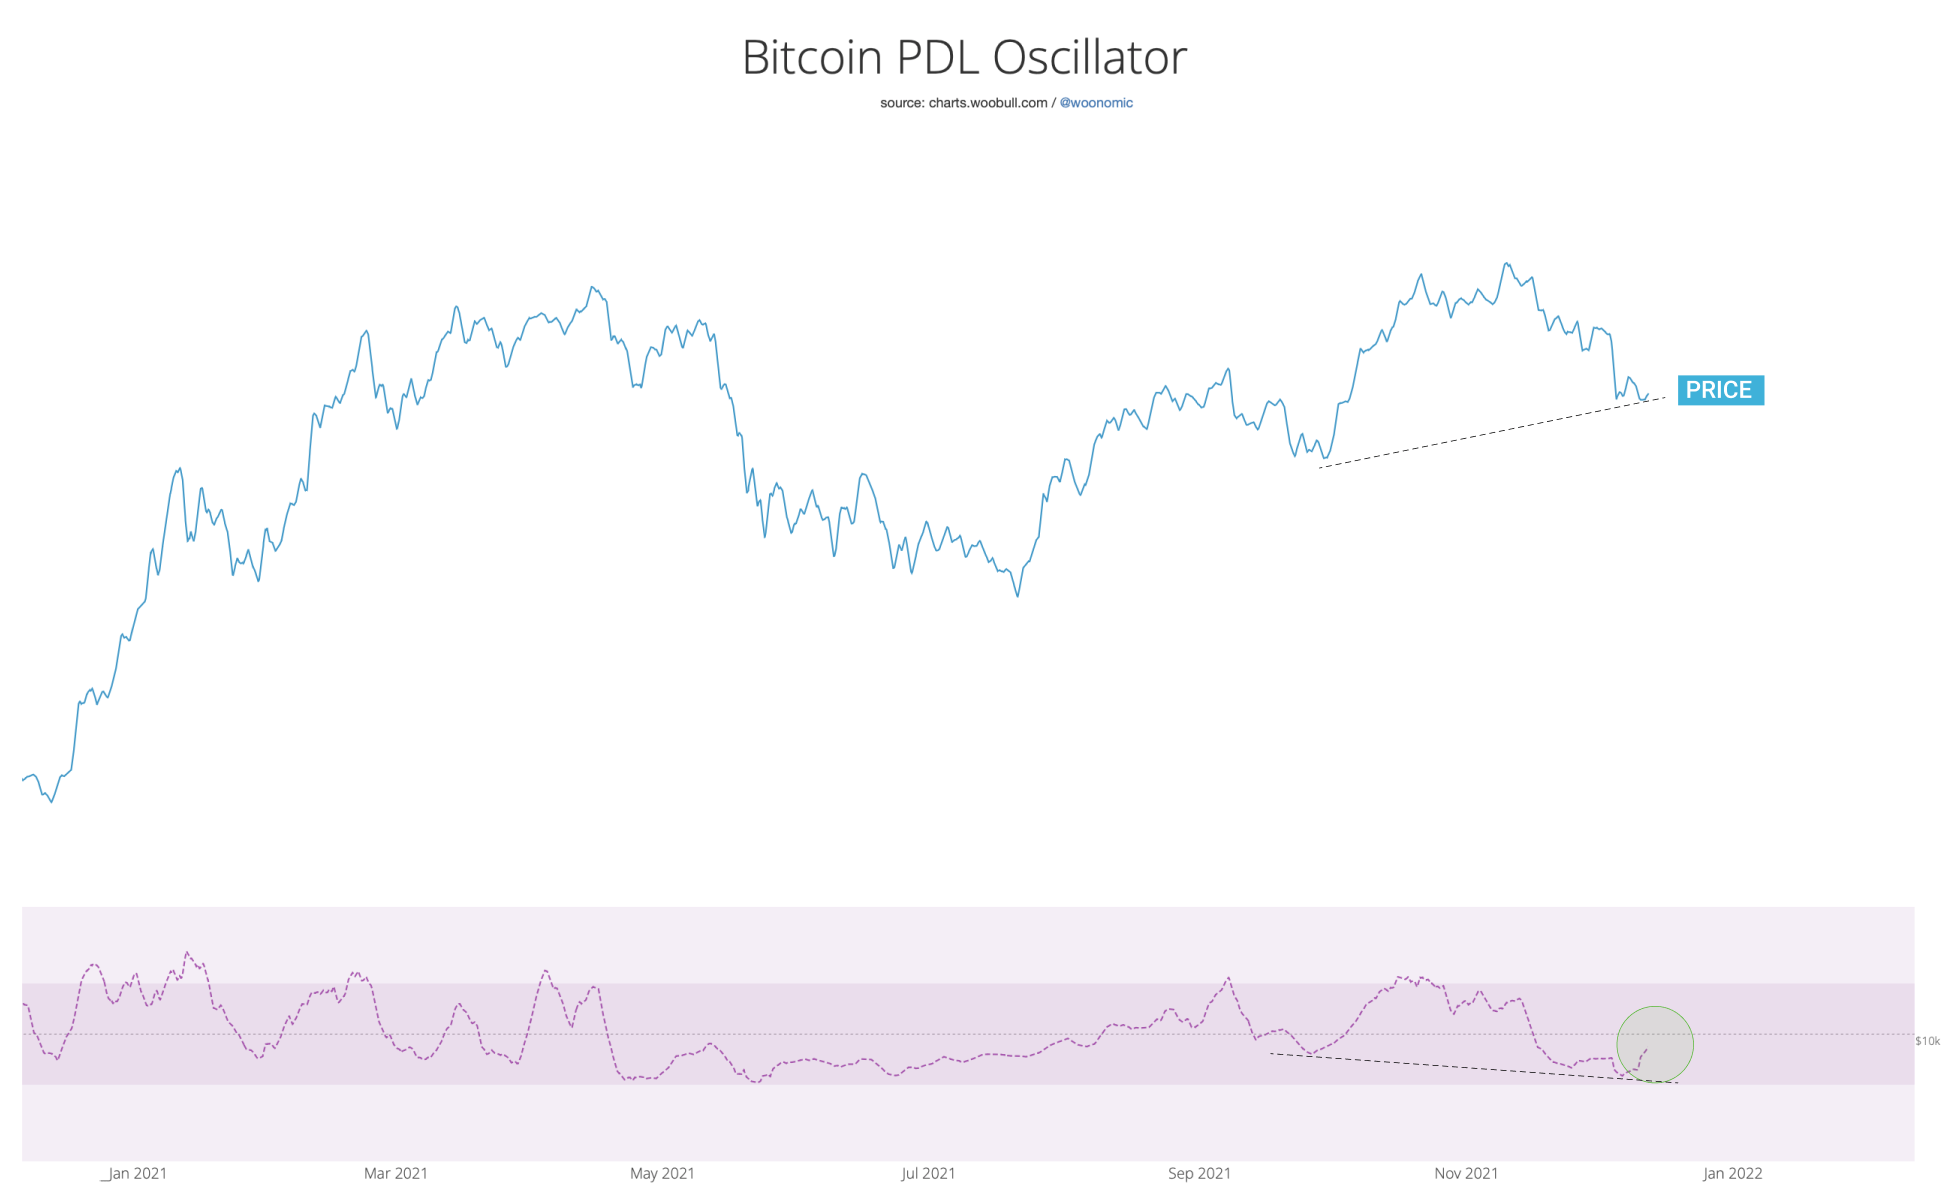
Shortest timeframe: Bottom may be in
My PDL Oscillator which looks at speculator demand on derivative exchanges has put in a bottom and finding strength, also forming a hidden bullish divergence. This suggests the bottom is in.
Links and References
Edit your subscription: Substack Dashboard
Newsletter Archives: The Bitcoin Forecast
Data Provider: Glassnode (free on-chain charts, paid tiers available)
Woobull on-chain charts: charts.woobull.com
Disclaimer
THE BITCOIN FORECAST DOES NOT MAKE ANY EXPRESS OR IMPLIED WARRANTIES, REPRESENTATIONS OR ENDORSEMENTS WHATSOEVER WITH REGARD TO THE REPORT/BLOG. IN PARTICULAR, YOU AGREE THAT THE BITCOIN FORECAST ASSUMES NO WARRANTY FOR THE CORRECTNESS, ACCURACY AND COMPLETENESS OF THE REPORT/BLOG.
YOU ARE SOLELY RESPONSIBLE FOR YOUR OWN INVESTMENT DECISIONS. WE ARE NEITHER LIABLE NOR RESPONSIBLE FOR ANY INJURY, LOSSES OR DAMAGES ARISING IN CONNECTION WITH ANY INVESTMENT DECISION TAKEN OR MADE BY YOU BASED ON INFORMATION WE PROVIDE. NOTHING CONTAINED IN THE REPORT/BLOG SHALL CONSTITUTE ANY TYPE OF INVESTMENT ADVICE OR RECOMMENDATION (I.E., RECOMMENDATIONS AS TO WHETHER OR NOT TO “BUY”, “SELL”, “HOLD”, OR TO ENTER OR NOT TO ENTER INTO ANY OTHER TRANSACTION INVOLVING ANY CRYPTOCURRENCY). ALL INFORMATION PROVIDED BY THE BITCOIN FORECAST IS IMPERSONAL AND NOT TAILORED TO YOUR NEEDS.
BY USING THIS REPORT/BLOG, YOU ACKNOWLEDGE THESE DISCLAIMERS.
Copyright
THIS NEWSLETTER IS COPYRIGHT © 2021 BY UNIQUE TEXT OFFERINGS (HK) LTD. ALL RIGHTS RESERVED.