Dear subscribers,
Welcome to The Bitcoin Forecast #023. It’s timely given the market setup.
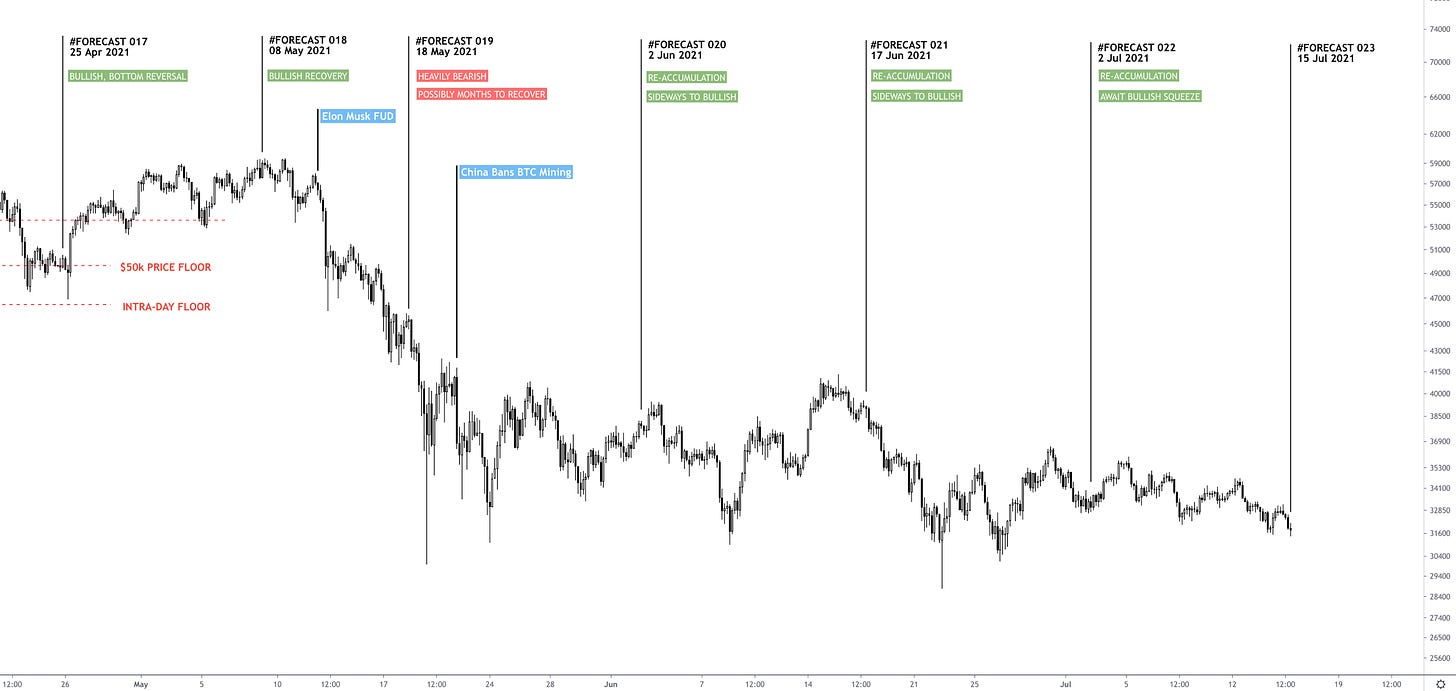
In my last forecast I outlined a significant divergence had formed between strong investor fundamentals underlying a market that’s been irrationally bearish with selling from short term speculators. This structure has continued and strengthened.
Time is now running out before Bitcoin’s next major price move. In this letter, I’ll outline the structural trend that’s taking place, the probable window for a price breakout and finally, we can look at the historical pricing Bitcoin has had in similar demand and supply situations.
Top level summary for 15th July 2021 (current price $31.8k):
Macro cycle: User growth is on a parabolic climb. Structurally we are in the middle of a bull market. This has not been reflected in price due to the size of the selling pressure of large investors (likely hedge funds) months ago, it’s forced a sideways re-accumulation band, where speculators who absorbed the coins are selling down their inventory to long term investors. The long term picture is strongly bullish once re-accumulation is complete.
Supply shock: The market is undergoing supply shock at levels that price it above $50k. Price needs to climb +50% to find balance with historical levels of valuation. This is expected to happen once fear subsides from the market. To do this price needs to break above its current resistance trend-line.
A large move is probable: Price action is setting up for a large squeeze, a significant move is expected soon. 17 Jul - 24 Jul is a high probability zone for a large price move.
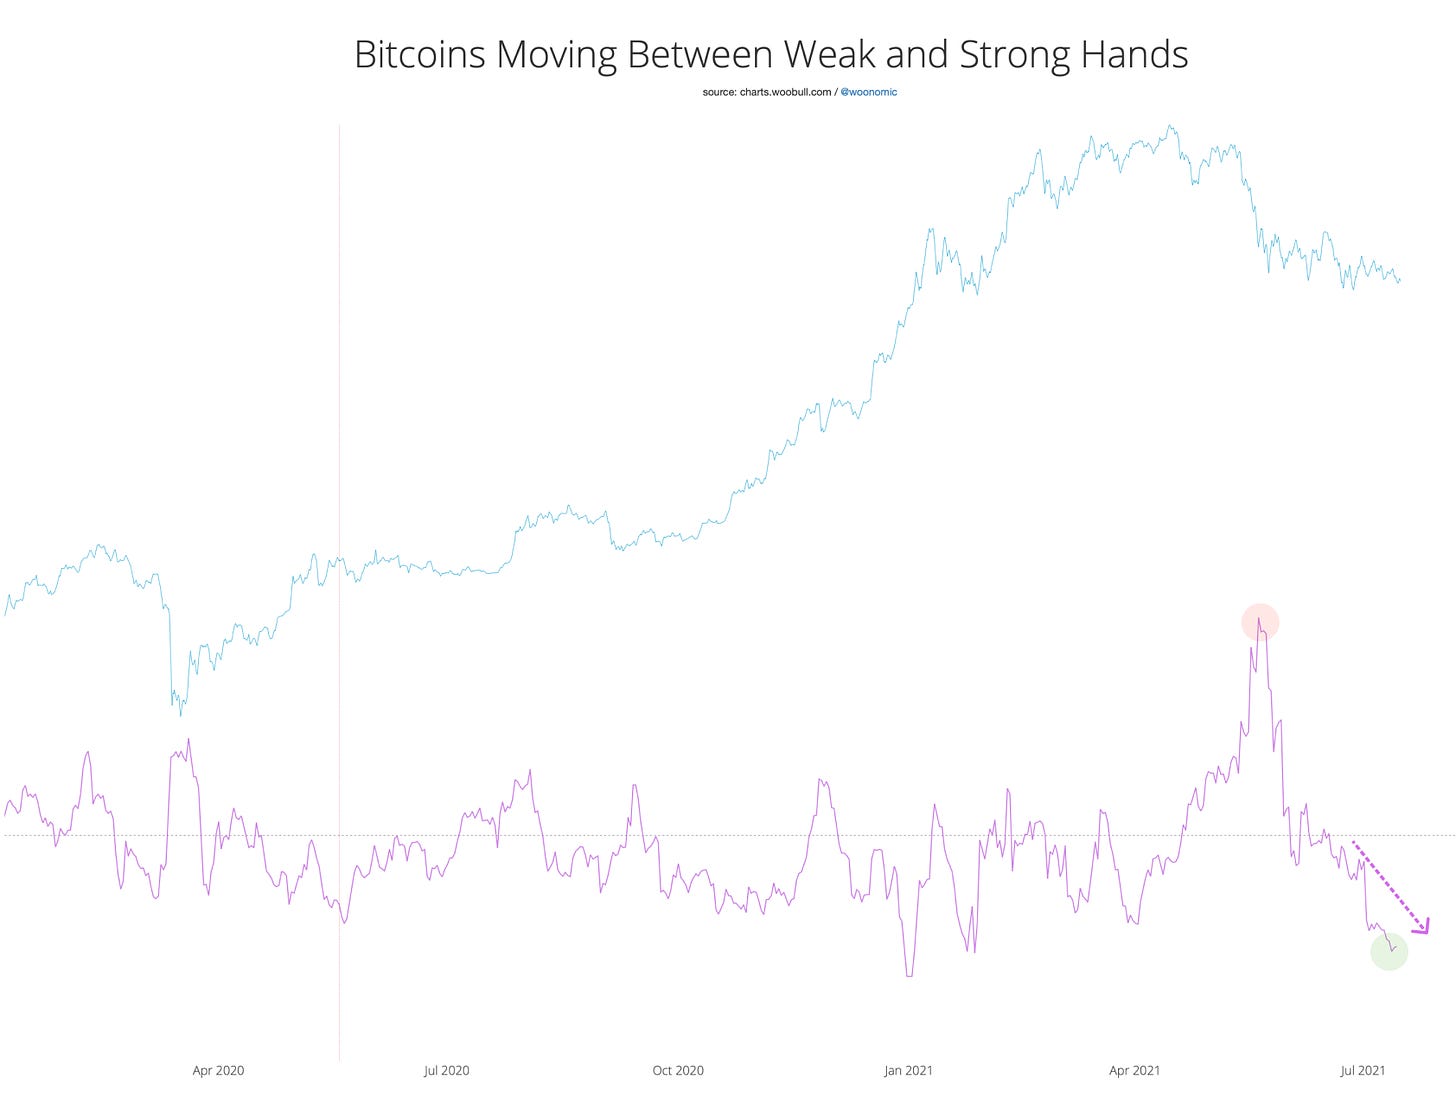
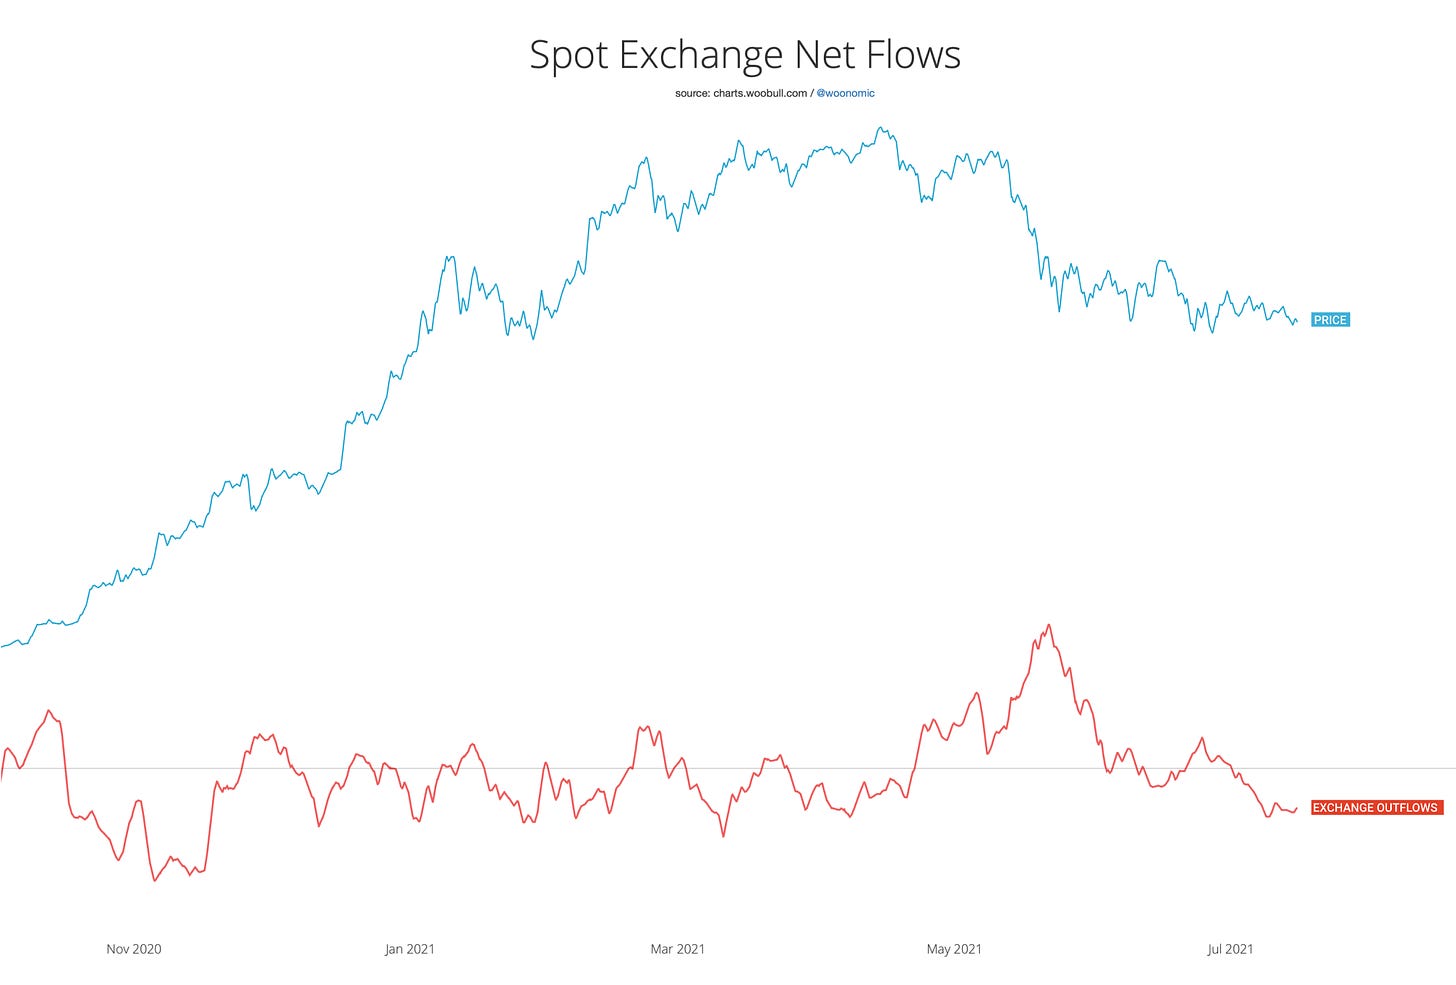
Short term on-chain metrics are bullish: Smart money has ceased selling. Long term investors are absorbing coins at peak levels. Exchange outflows are signalling consistent buying demand.
Price action expectation: I’m expecting price to break from its bearish sideways band in the coming week followed by a recovery to the $50k-$60k zone before some further consolidation.
IMPORTANT NOTE:
All forecasts are probabilistic with roughly 80% historical reliability for short time frame forecasts. Longer range forecasts are more reliable due to fundamentals prevailing over the long run, shorter time frames are subject to unpredictable events and the randomness of markets. Short term speculators should use appropriate risk management.
Analysis Breakdown
Growth is going parabolic and the market is oblivious
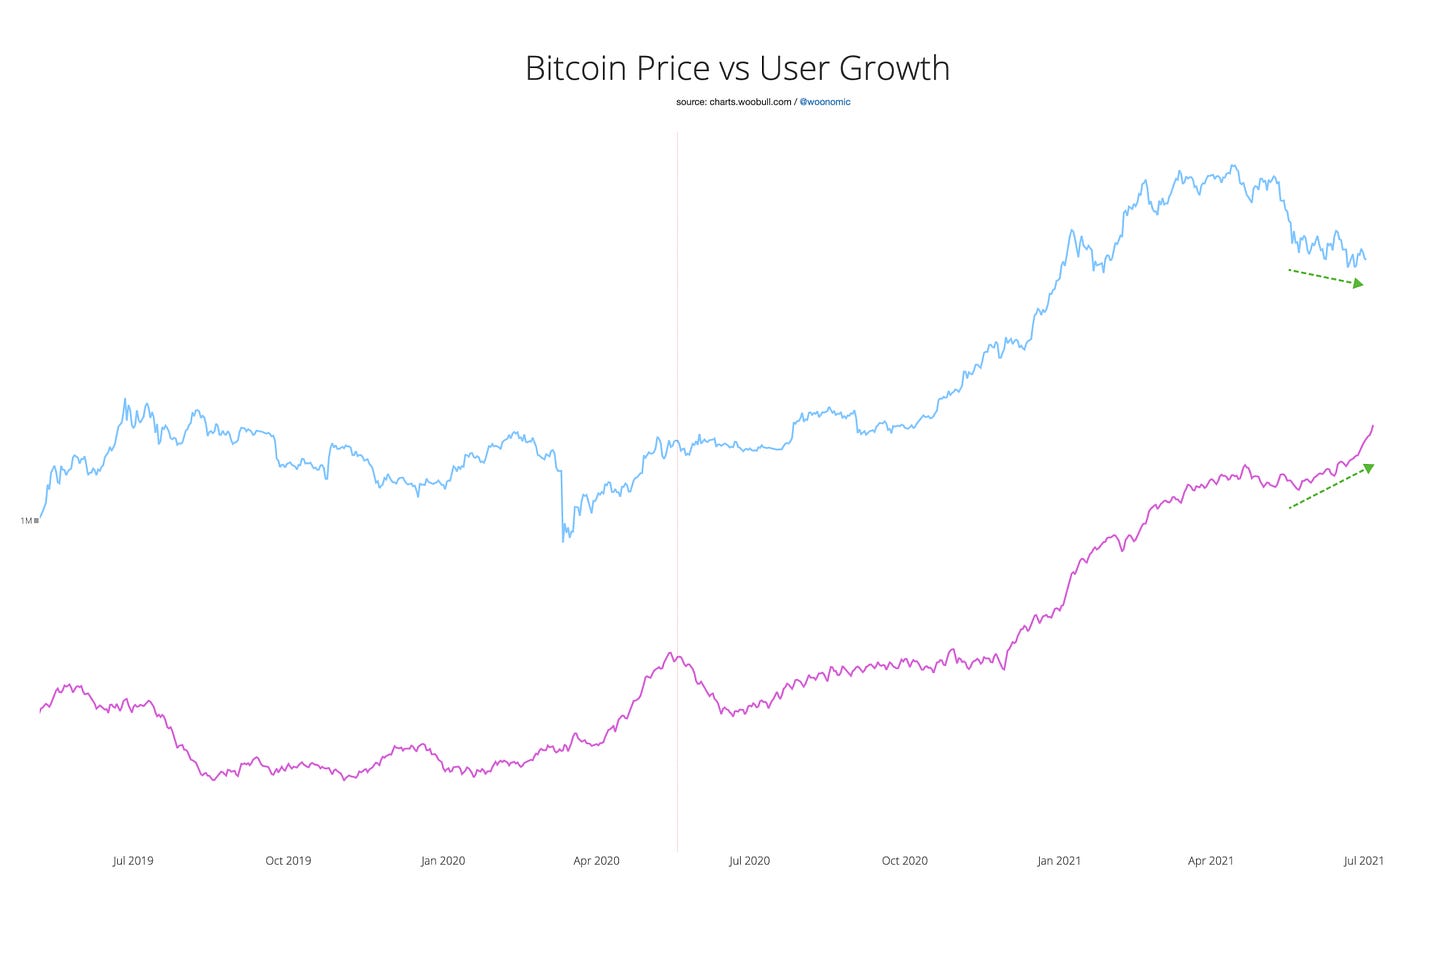
As mentioned in my last two letters, the fundamentals of user growth on the network are solidly bullish. There’s no structural signs of a bear market in sight. In fact we are in a region of parabolic growth (even on a log chart).
The chart below visualises this clearly, plotting the price of BTC next to the increase in users seen coming onto Bitcoin’s blockchain per day.
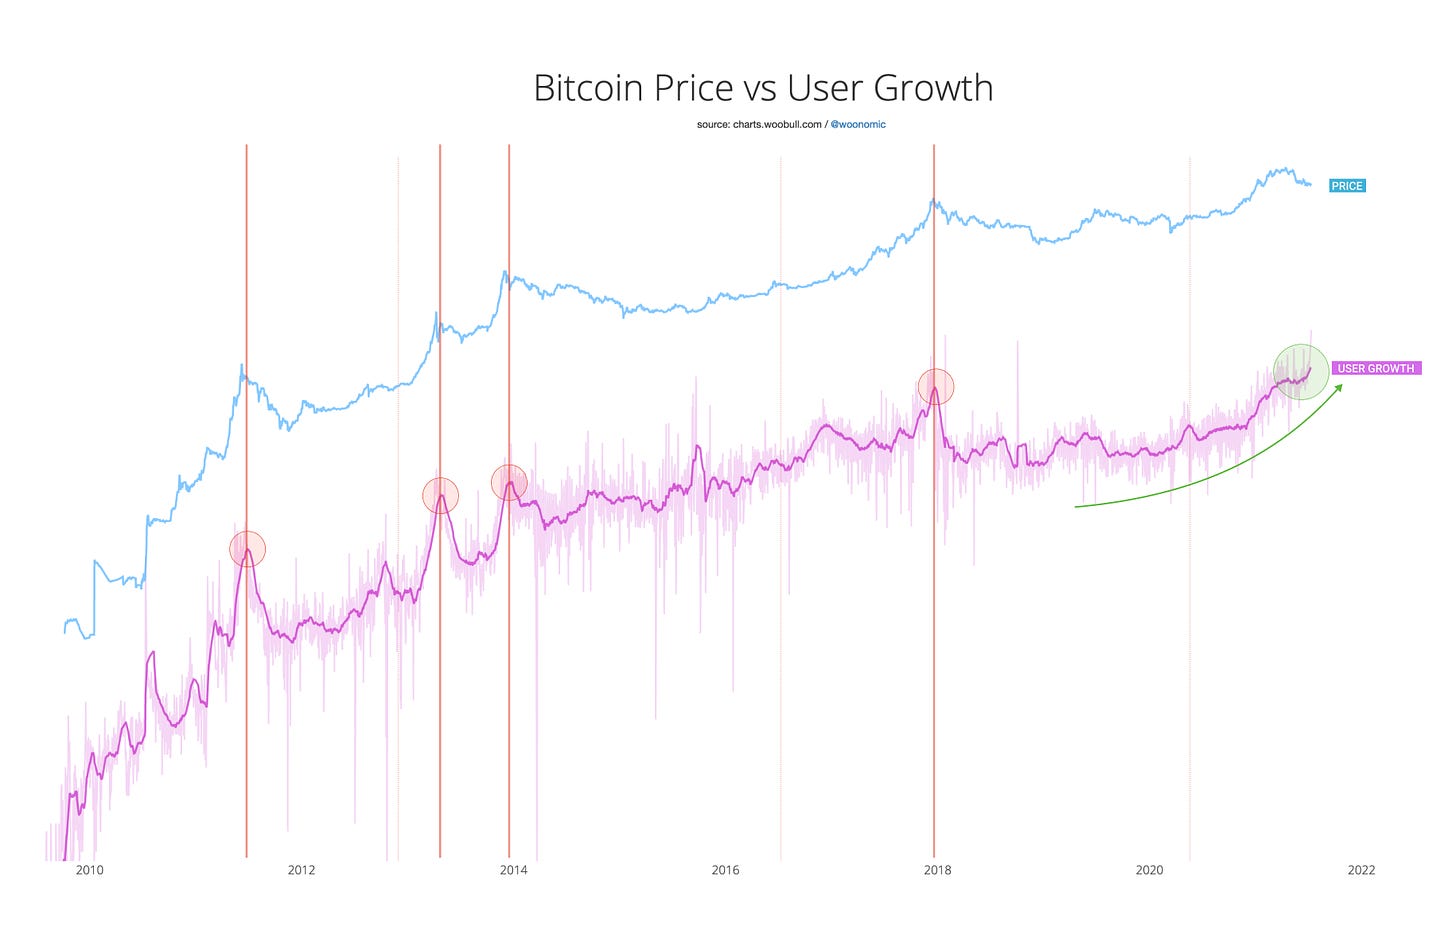
I’ve marked in the chart above what happens at the start of true bear markets in red circles; new users stop coming in.
Zooming into the green circle in the chart below, there’s a clear divergence between price and fundamentals.
In my years 8 years in Bitcoin’s market I have never seen fundamentals not play out over price action given enough time. The market is not pricing the bullish fundamentals, which opens up a great buying opportunity for those who are patient.
Understanding supply shock
A supply shock happens when a shortage of coin availability on the market makes its bullish impact on price.
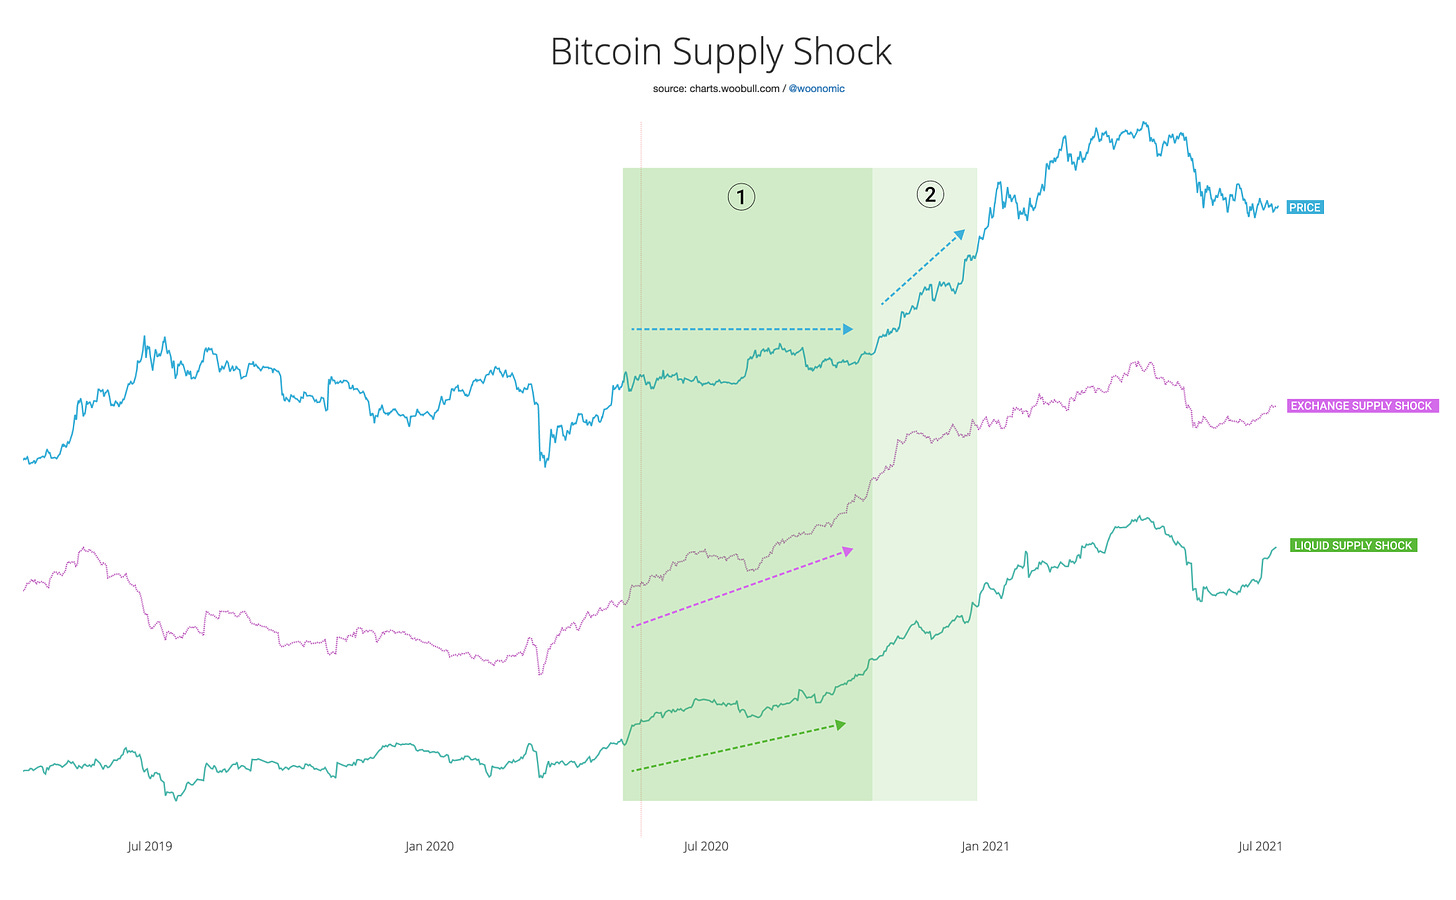
We’ve seen this before. The bull run we had from $10k to $60k from October 2020 was driven by a supply shock that was building for over 6 months completely unacknowledged by the market. Price eventually squeezed upwards in a very fast move. While technical traders screamed “overbought” from the sheer rate of climb, in reality the market was simply finding its balance again pricing the new fundamentals correctly. The market is irrational in short time frames, but fundamentals always prevail.
How is Supply Shock calculated?
Supply Shock is the ratio of coins that are UNAVAILABLE vs AVAILABLE to the market. This can be estimated in two ways:
Exchange Supply Shock uses coins in investor cold storage (unavailable) vs speculative coins on exchanges (available).
Liquid Supply Shock uses coins held by long term investors (unavailable) vs coins held by speculators (available). This qualitative view requires the use of Glassnode’s Liquid Supply data which segregates users into “strong holders” or “speculative” based on their historic wallet behaviour.
The supply shock is strengthening
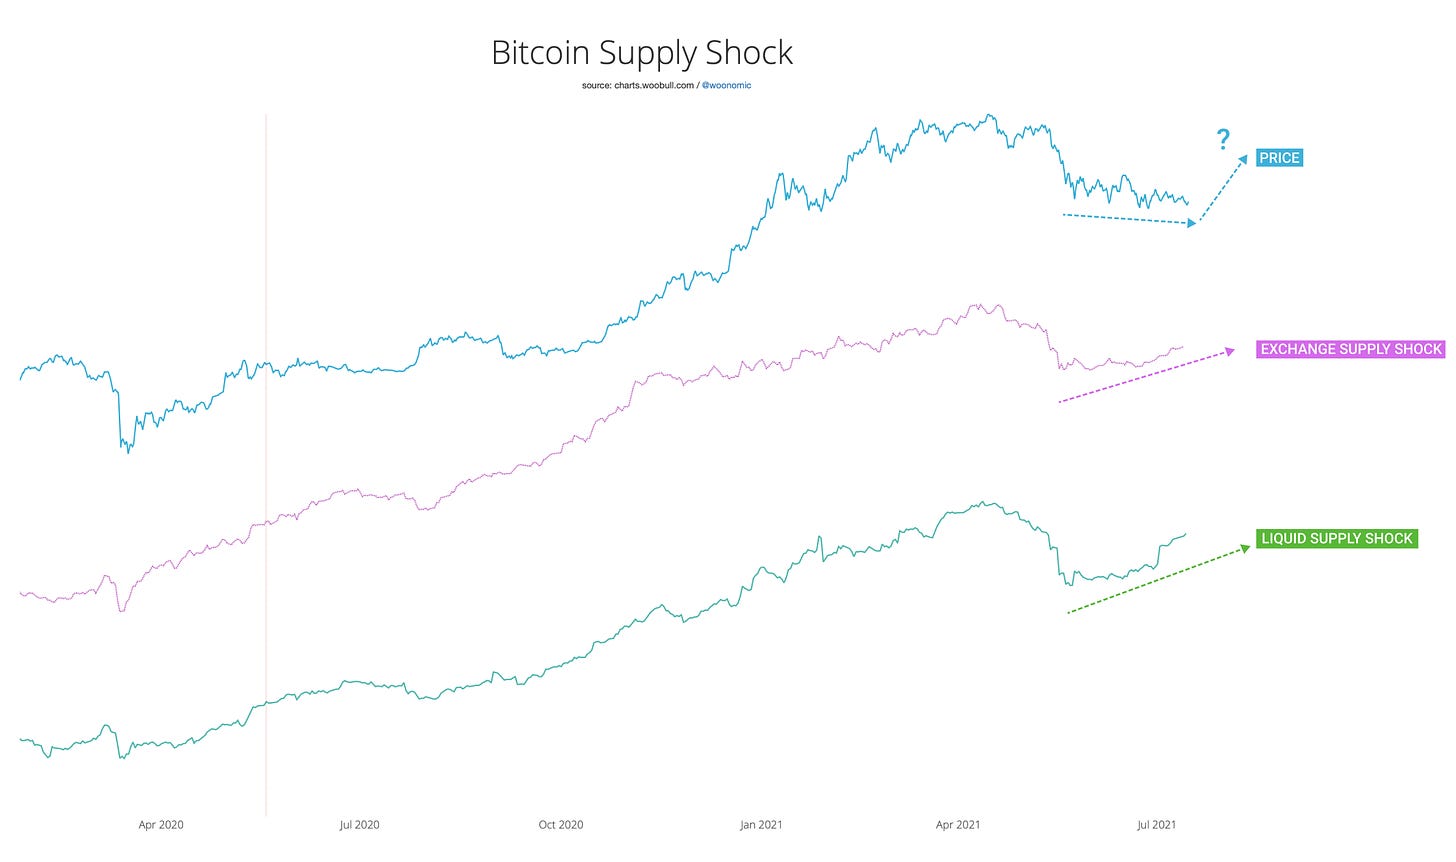
The supply shock covered in my letter 2 weeks ago has gained further strength.
Much like the divergence we saw with user growth above, we are currently in a new bullish divergence where a supply shock is forming that is not yet acknowledged by price. Unless long term investors start selling down their coins in the coming weeks (unlikely given the growth of the network), the price action will need to break upwards to properly price in the supply and demand imbalance.
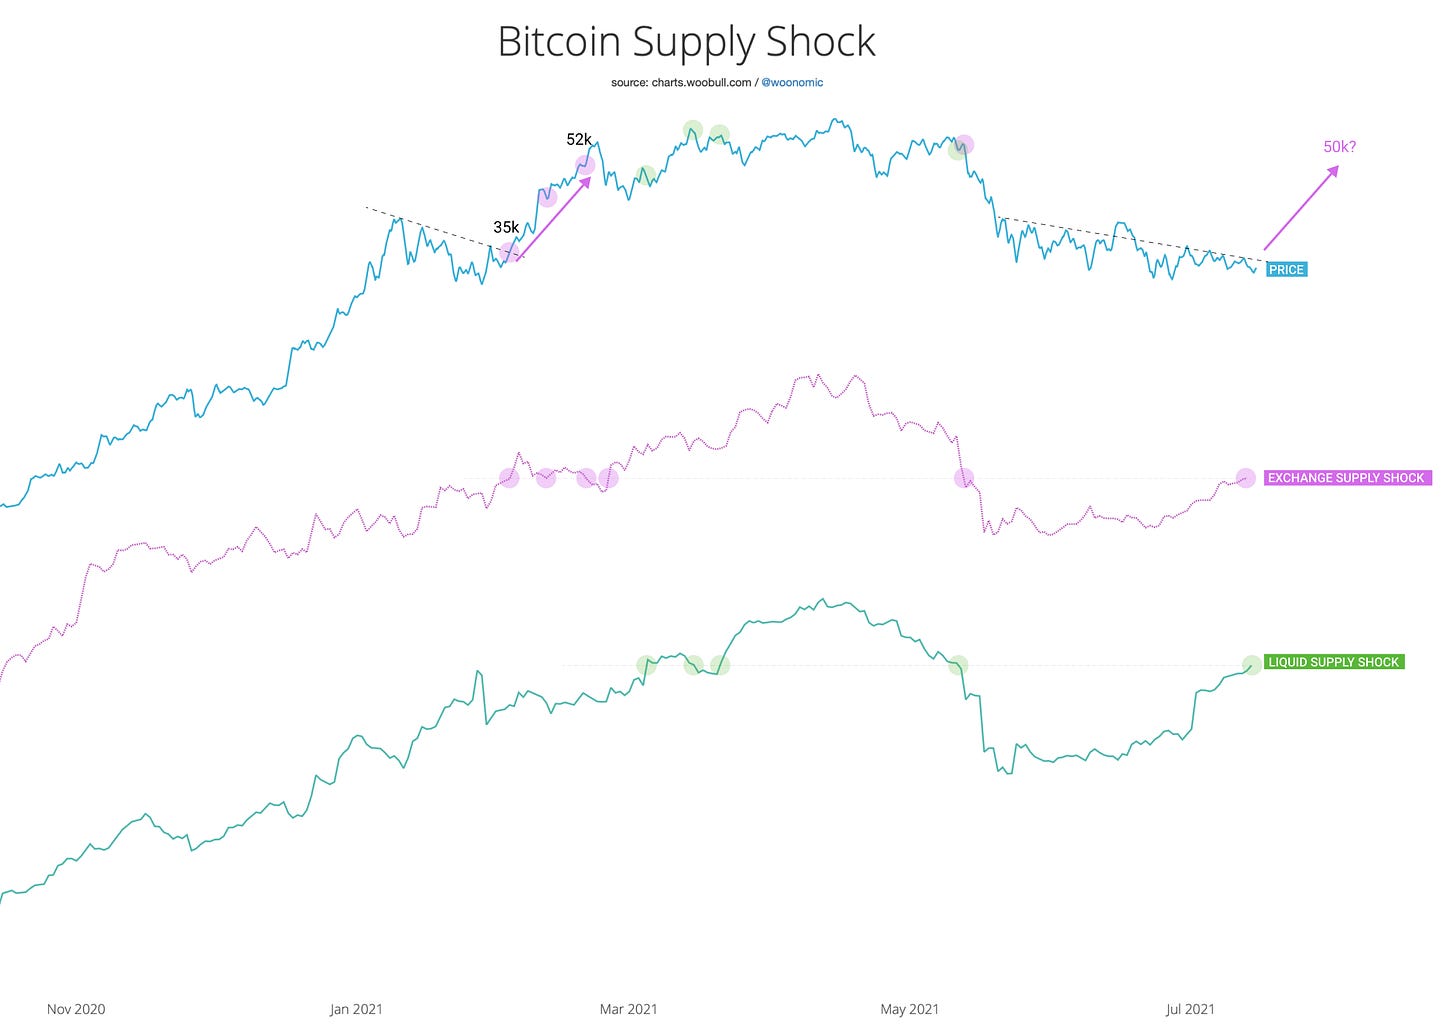
Supply shock suggests pricing above $50k
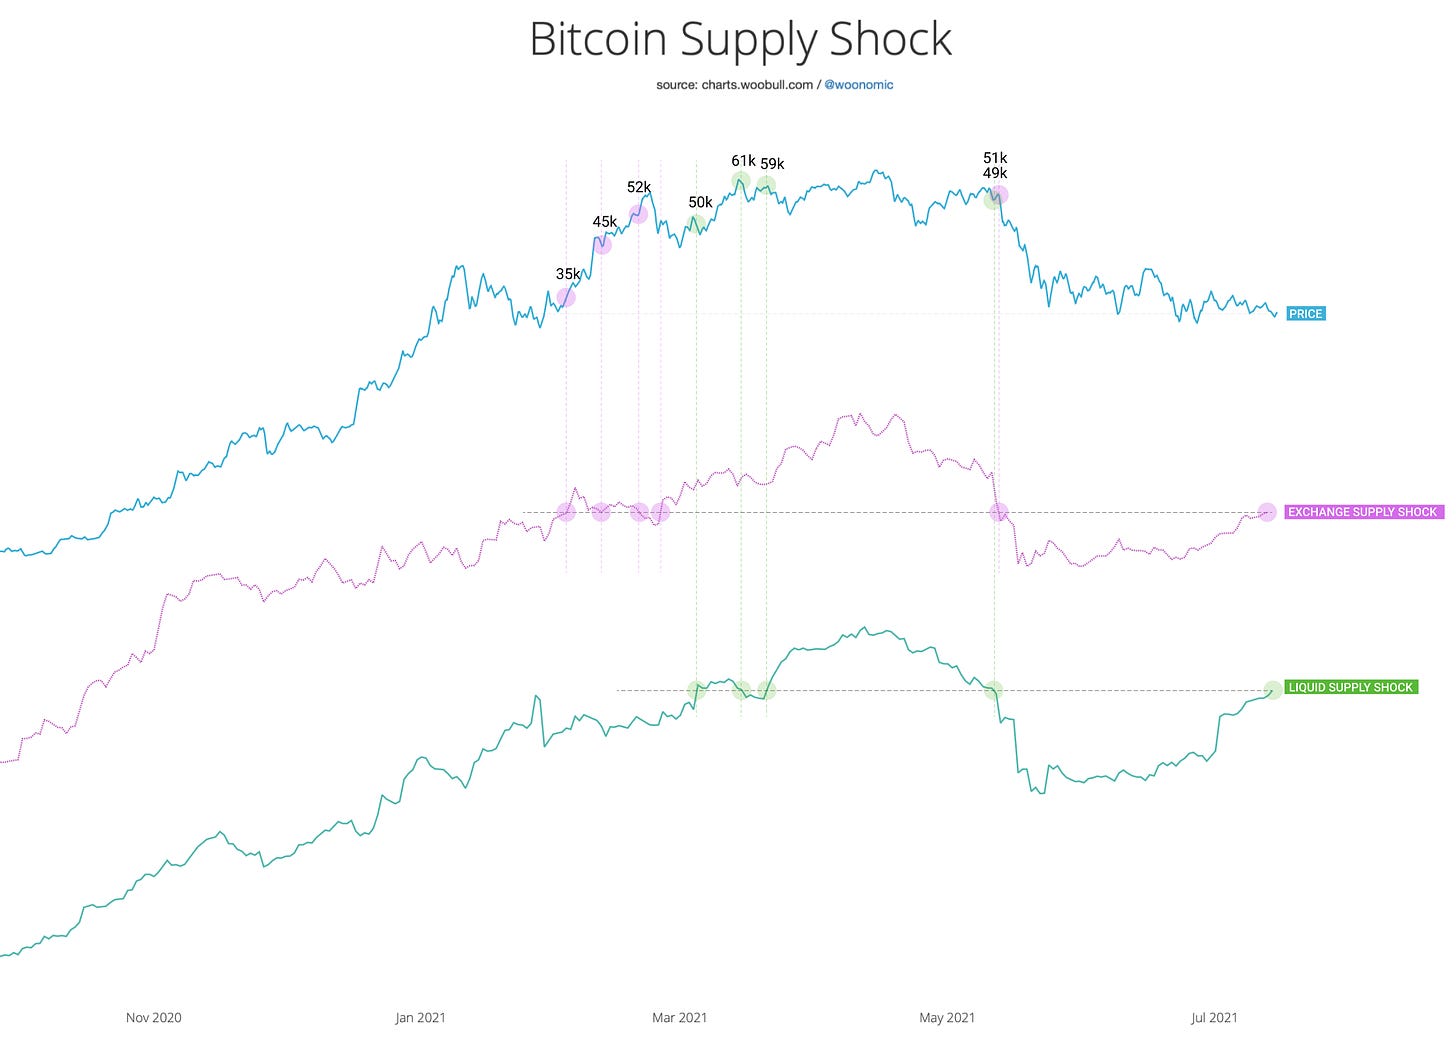
In the chart below I’ve highlighted today’s level of supply shock and derived how the market historically priced it.
The 8 readings result in an average of $50.2k. This is more than 50% greater than today’s price.
I’ll also point out that the lowest valuation of $35k was during a time of heightened fear similar to today. Once the fear subsided by climbing past the resistance trend-line, the market rallied the valuation quickly to $52k. This is very similar to today’s setup; climbing past the resistance trend-line will alleviate fear, opening a path to resume normal supply shock valuation levels above $50k.
A large price move is very probable
There’s a law in markets where long periods of low volatility are followed by large price moves.
Why is low volatility followed by large price moves?
Traders thrive on volatility, as it drops trading conditions suffer and liquidity dries up. Risk protective stop-losses form a tight band. When price finally makes a break, the volume created by triggering the stops tightly clustered forms a large impulse of volume, this volume builds directional momentum against a backdrop of thin liquidity. This allows price to be propelled in a direction without resistance.
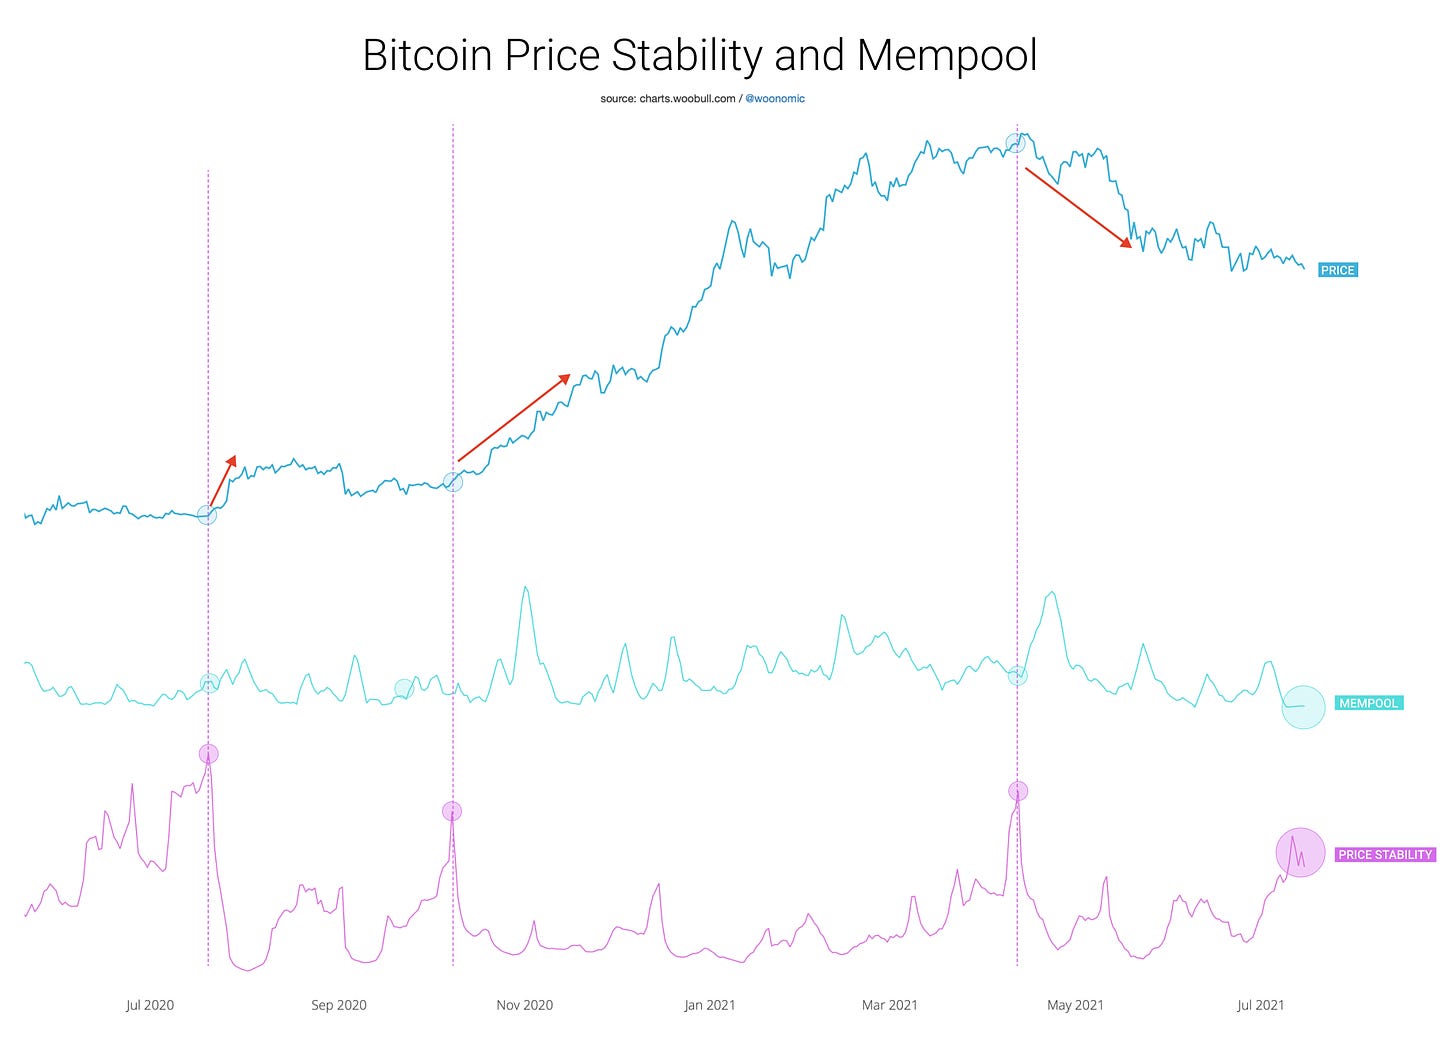
Bitcoin price is now forming one of the largest zones of low volatility seen this year.
We can see in the chart above that price stability is forming a peak, along with Bitcoin’s mempool being near lows. BTC’s large moves have historically come in times when its mempool is at lows.
Key dates to keep in mind:
Grayscale unlocks shares 17 July
Next network difficulty adjustment 18 July
All factors combined indicate we are approaching a high probability window for a large price move starting this coming week.
BULLISH: “Smart money” has stopped selling
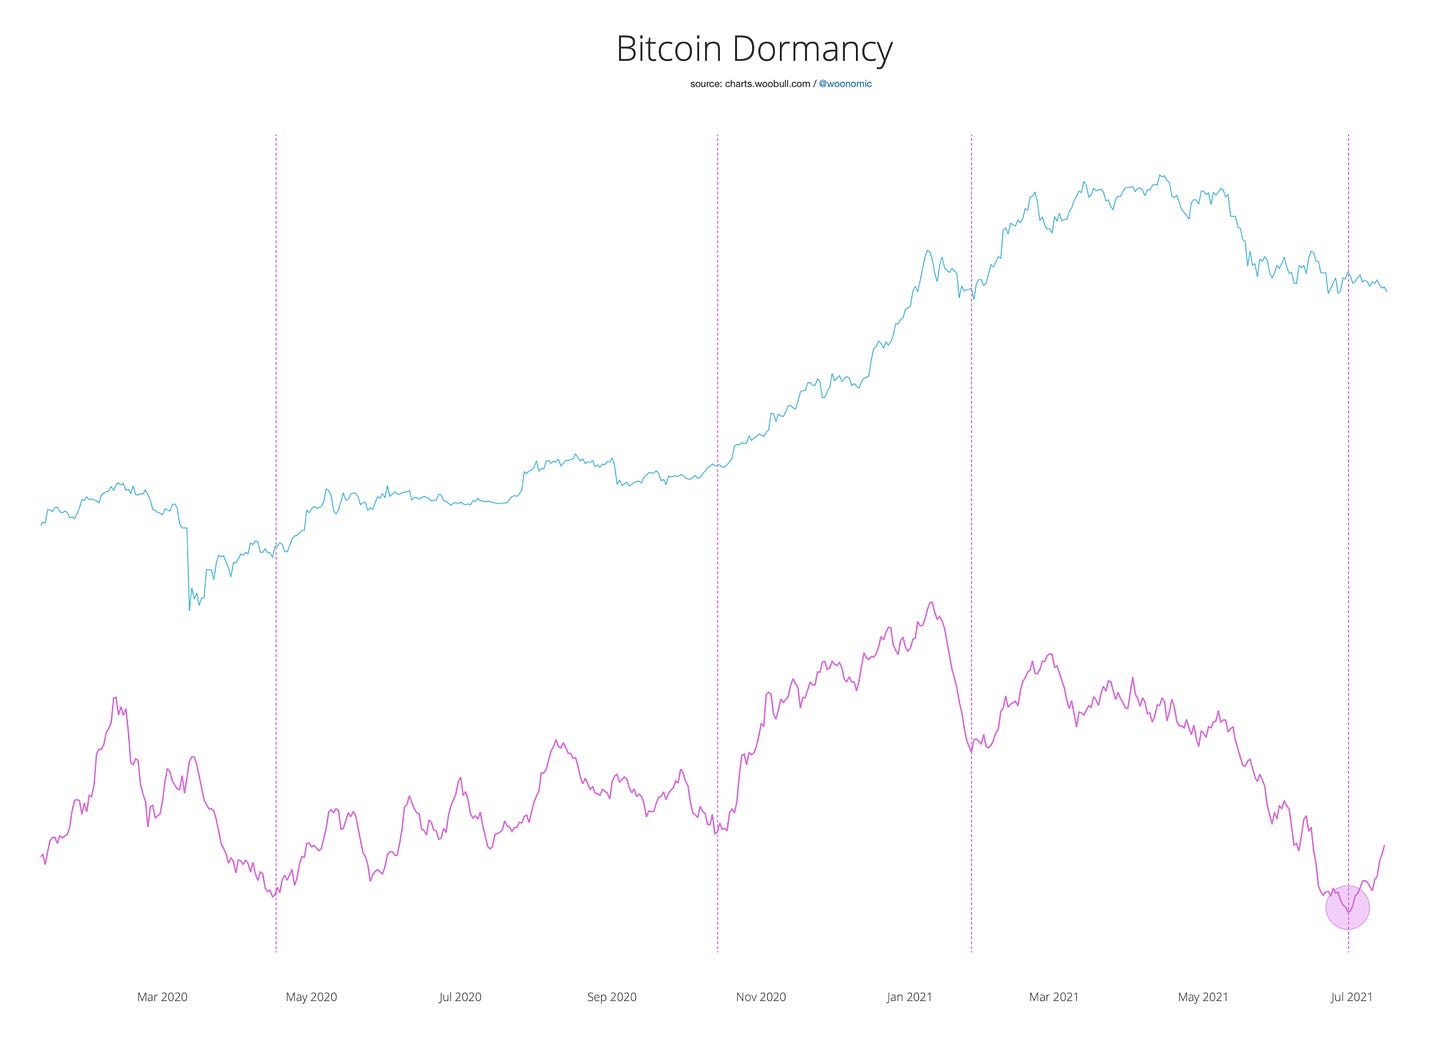
Dormancy is has formed a bottom. Dormancy measures the age of coins transacting between investors. When dormancy is at a minimum, it signals more experienced “smarter” investors have stopped selling.
BULLISH: Long term investors are at peak rates of accumulation
Coins are moving away from speculators to long term investors (strong hands) now at a rate unseen since February when price propelled from $30k to $56k
BULLISH: Coins are moving off exchanges
Exchange flows have been consistently bullish indicating coins being bought and moved off-exchange into cold storage. (This is another view into supply shock)
Links and References
Edit your subscription: Substack Dashboard
Newsletter Archives: The Bitcoin Forecast
Data Provider: Glassnode (free on-chain charts, paid tiers available)
Glossary: Glassnode Academy (definitions for these on-chain metrics)
Twitter: @woonomic
Woobull on-chain charts: charts.woobull.com
Disclaimer
THE BITCOIN FORECAST DOES NOT MAKE ANY EXPRESS OR IMPLIED WARRANTIES, REPRESENTATIONS OR ENDORSEMENTS WHATSOEVER WITH REGARD TO THE REPORT/BLOG. IN PARTICULAR, YOU AGREE THAT THE BITCOIN FORECAST ASSUMES NO WARRANTY FOR THE CORRECTNESS, ACCURACY AND COMPLETENESS OF THE REPORT/BLOG.
YOU ARE SOLELY RESPONSIBLE FOR YOUR OWN INVESTMENT DECISIONS. WE ARE NEITHER LIABLE NOR RESPONSIBLE FOR ANY INJURY, LOSSES OR DAMAGES ARISING IN CONNECTION WITH ANY INVESTMENT DECISION TAKEN OR MADE BY YOU BASED ON INFORMATION WE PROVIDE. NOTHING CONTAINED IN THE REPORT/BLOG SHALL CONSTITUTE ANY TYPE OF INVESTMENT ADVICE OR RECOMMENDATION (I.E., RECOMMENDATIONS AS TO WHETHER OR NOT TO “BUY”, “SELL”, “HOLD”, OR TO ENTER OR NOT TO ENTER INTO ANY OTHER TRANSACTION INVOLVING ANY CRYPTOCURRENCY). ALL INFORMATION PROVIDED BY THE BITCOIN FORECAST IS IMPERSONAL AND NOT TAILORED TO YOUR NEEDS.
BY USING THIS REPORT/BLOG, YOU ACKNOWLEDGE THESE DISCLAIMERS.


